The real benefits of simulation
The capabilities of advanced building-simulation software are enormous, as explained by
Dr Alan Jones to Ken Sharpe for various types of air-conditioning system.
How do you compare the performance of different ways of air conditioning a building, such as fan coils and chilled beams — short of having identical buildings in identical surroundings?
That ain’t going to happen, so what are the realistic options?
One stage on from catalogue data are room-scale mock-ups at a fixed set of conditions, but such testing hardly reflects the constantly changing conditions experienced by a real building during a year.
Enter building-simulation software, which can analyse the behaviour of a building on an hourly basis, and then feed into that software actual performance data from manufacturers rather than generic data for particular items of building-services plant and equipment. Such hourly results enable you to home in precisely on potential problems that occur very occasionally during a year and also give an accurate big picture in terms of annual energy consumption.
That is just what Environmental Design Solutions (EDSL) has done for air-conditioning systems based on fan-coil units (both constant air volume and variable air volume) and chilled beams in a simple building to Part L2 and the current London design Summer year. The FCU and chilled-beam data both came from the same manufacturer (Trox), so there is no bias.
The comparison was made using EDSL’s Tas software and presented to us by Dr Alan Jones, managing director of EDSL. He says, ‘The kind of analysis we are doing is unique; no-one else can do it. Introducing manufacturers’ data into an analysis is crucial.’
What is fascinating is how quickly building simulation software will produce results for questions such as the effect of changing flow and return temperatures, ventilation rates, the free-cooling effect of more fresh air etc. It also helps puts a perspective on the fixation that the flow/return temperatures to FCUs should be 6/12°C rather than, say, 11/15°C.
The model building, in a nutshell, has three storeys and a north/south axis. It is 30 m square with an 18 m-square central core and 6 m-deep perimeter zones. The corner zones are thus 6 m square.
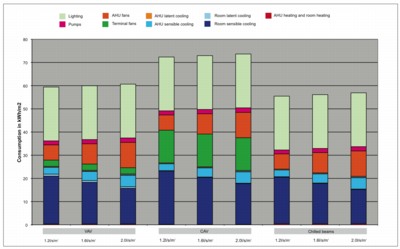
The analysis of total building energy use for a year (see the two graphs) reveals what is already generally accepted — that buildings with chilled beams have a significantly lower energy consumption than buildings with constant-air-volume FCUs (over 20% less). It also throws into perspective the marked reduction in energy consumption of FCUs with ECDC motors. Buildings with chilled beams still use less energy in a year (about 6% less), but as Dr Alan Jones points out, that gain comes at the price of a higher capital cost for chilled beams.
Among the design parameters implicit in this analysis are 1.6 l/s/m2 of fresh air at 15°C, air flow from FCUs and chilled beams of 9 l/s/m2, a specific fan power for the main air-handling unit of 1.8 W/l/s and 75%-efficient heat recovery in the AHU (as required in the 2010 Building Regulations). The induction rate for the chilled beams is 5.6, which is described by Alan Jones as a ‘good bit of kit, but not the best’. Finally, the specific fan power of the ECDC FCUs is 0.3 W/l/s.
The Tas analysis clearly reveals just how much the energy performance gap between FCUs and chilled beams has been closed with the introduction of ECDC motors reducing specific fan power and permitting variable-speed operation.
However, looking more closely at both sets of graphs (Figs 1 and 2) gives important insights into the extra energy required as the fresh-air rate is increased from 1.2 l/s/m2 right up to
2 l/s/m2 and the energy-saving benefits of free cooling on the chiller.
It should be stressed that both graphs are based on chilled water at 11/15°C.
For chilled beams and ECDC FCUs the extra energy requirement for the increased ventilation is only 3 to 4% — and that is without free cooling on the chiller. Alan Jones explains why the increase in energy consumption is so small: ‘Although bringing in more fresh air increases the energy used by the AHU fan [orange on the graphs], the energy usage of the chiller is reduced by the free-cooling effect of more fresh air — so there is no significant energy penalty for a well ventilated building.
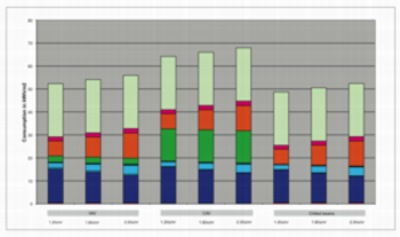
Having flow/return temperatures of 11/15°C makes possible free cooling to the chiller when the ambient temperature falls below 10°C, and Tas can show the effect — an annual energy saving of 7 to 10% depending on the ventilation rate (Fig. 2). Fig. 3:Alan Jones draws attention to the greater energy penalty of increased ventilation, which he explains is due to free cooling at the chiller reducing the benefit of free cooling from more fresh air.
Carrying out such detailed analysis is far from time consuming. Tas takes only about a second to carry out an hourly simulation for a zone for a whole year.
That’s the big picture, and this kind of analysis from building simulation software can be used to support a planning application as an alternative to an SBEM monthly based analysis. What the design engineer also needs to know is how the cooling system will perform at
peak load, especially with the flow/return temperatures of 11/15°C that have been fed into the calculations. Here an analysis of the 6 m-square south-west zone with its peak cooling load of 90 W/m2 is required.
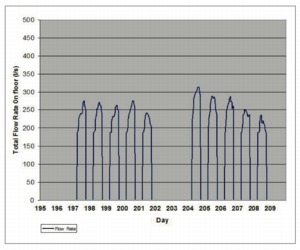
Displaying the cooling load for every one of the 8760 hours of a year quickly shows that the peak occurs in mid-August.
Zooming into that 2-week period (Fig. 3) for a VAV fan-coil system with 1.6 l/s/m2 of fresh air shows the daily flow rate from FCUs having modulating speed control from 60 to 100% (the minimum of 60% being to avoid the dumping of cold air from grilles in the ceiling).
On day 197 is discernible when the fan speed starts to ramp up from 60% (just below 200 l/s).
Only on day 204 does the fan speed reach 100%, indicated by the flat part of the flow-rate curve just above 300 l/s — and this is achieved with flow/return temperatures of 11/15°C.
Tas can produce seemingly endless graphs, two of which show hourly air temperature and relative humidity in the south-west zone for the same two weeks with VAV and chilled-beam systems.
The message of those graphs is that room conditions are kept below the maximum design point of 24°C by both systems for all but a few hours on day 204, when the temperature just tops 24°C.
Relative humidity is generally around 55% for the VAV system, with the occasional spike at the start of the working day. With chilled beams, RH ranges from 50% to a little over 60%, and there is just a touch of misting on the chilled beams on the very hottest days.
As Alan Jones explains, ‘Being able to perform building simulations using data from manufacturers rather than “generic” data is a major advance in building simulation and should make possible more accurate and reliable predictions of the behaviour of buildings and their energy performance.’
It would be interesting and extremely helpful to see how the predictions of building simulations are reflected in real buildings. Given the relationships EDSL has with some of its major clients, that prospect might not be too far away.
www.edsl.net